Process
Lean UX in an Agile development environment naturally encourages rapid, iterative UX phases, which place a heavy focus on refinement, user input, and team collaboration. Project managers, designers, and developers work alongside throughout the entire process to implement stakeholder / business goals and user goals. This process is quick, efficient, accurate, precise, and adaptive. It is custom-tailored to each project, allowing it to yield high quality UX in any circumstance.
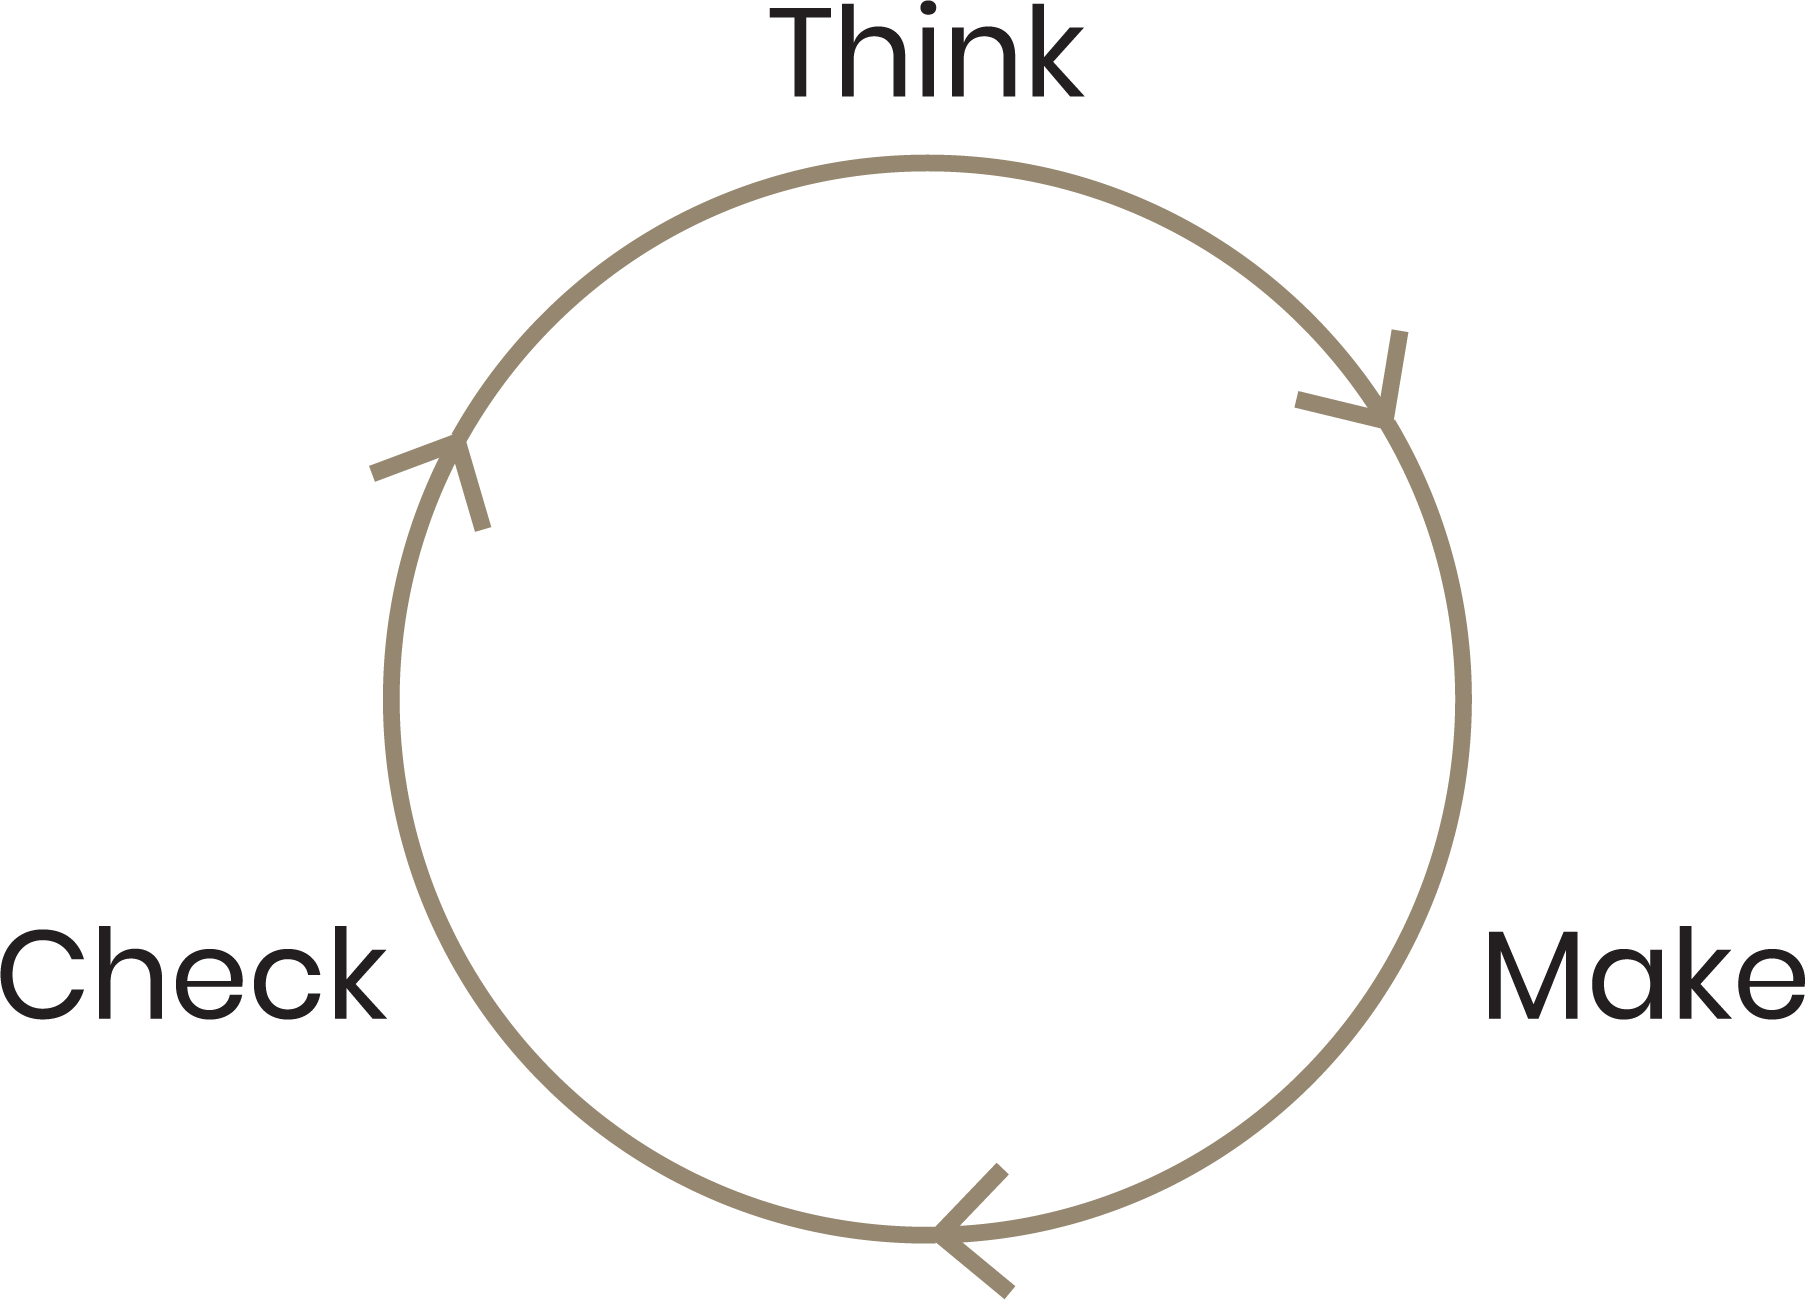
Lean process
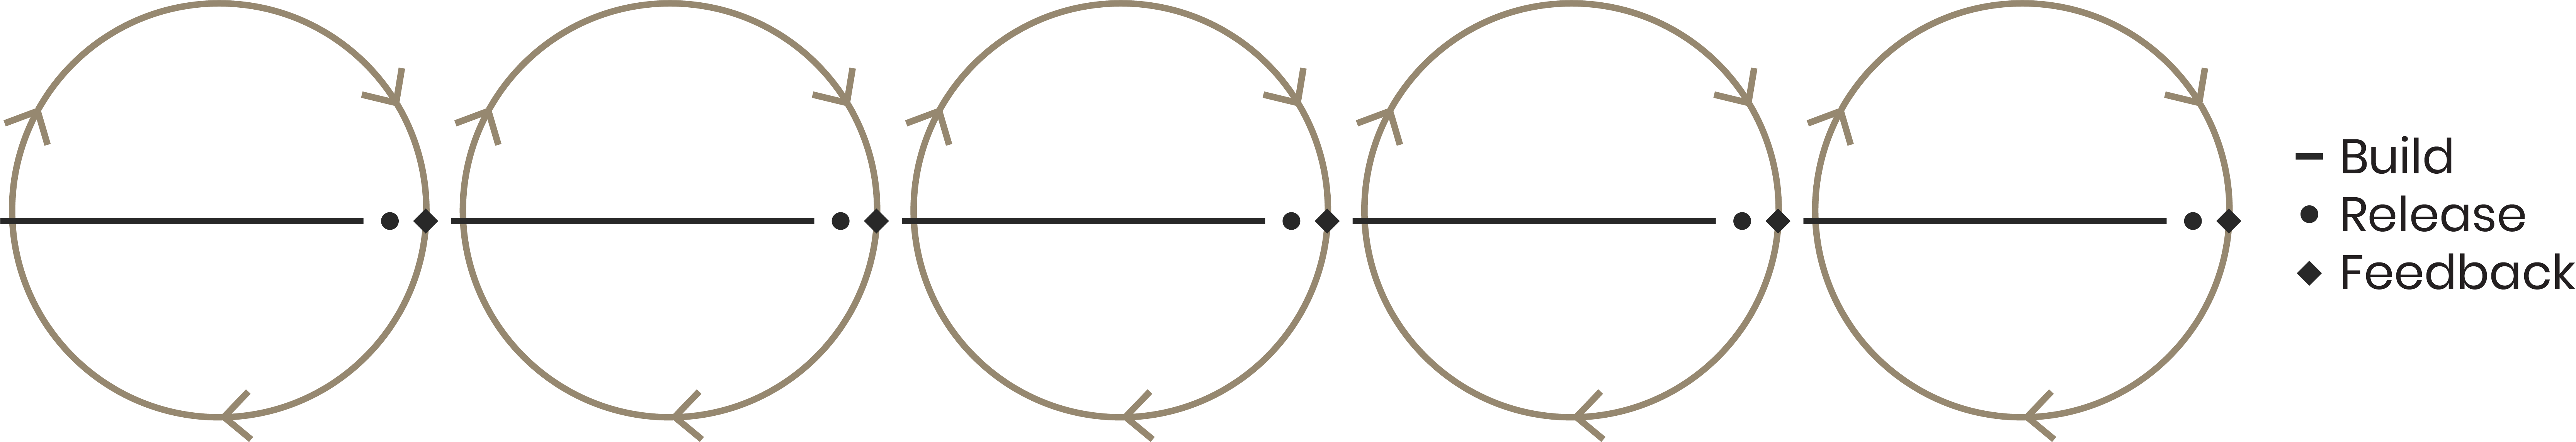
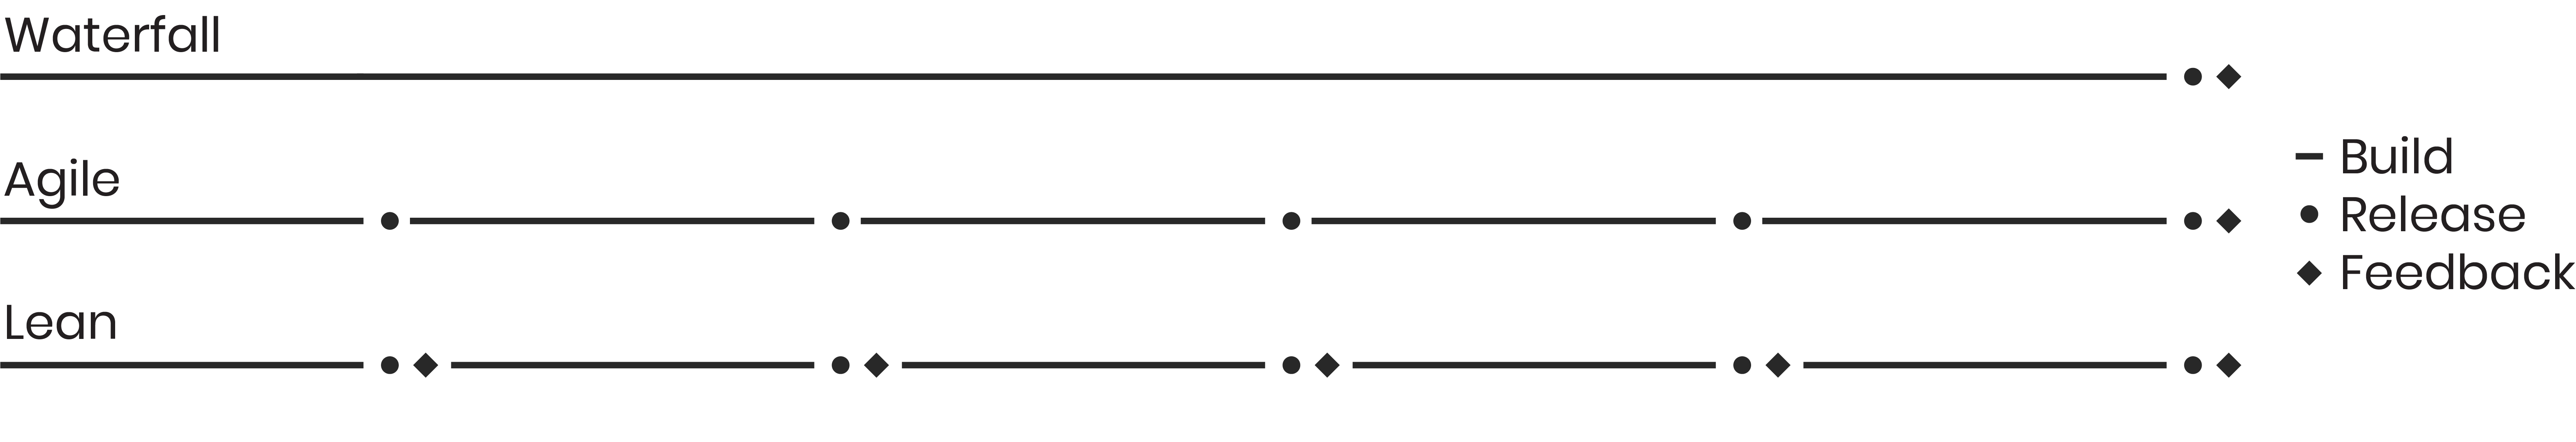
Process comparison
Phases and Deliverables
01. Think
Strategy, research, and analysis
Strategy
- Competitive analysis
- Stakeholder interviews
- Brainstorming
- KPI definition
- Value proposition
- Ecosystem map
- Mood boards
- Story boards
- Analytics review
Research
- Surveys
- Content audit
- User interviews
- Card sorting
- Heuristic review
- User testing analysis
- A/B testing
- Analytics review
Analysis
- Personas
- Scenarios
- Mental models
- Use cases
- User flows
- Heuristic review
- User testing analysis
02. Make
Design and implementation
Design
- Collaborative design
- Content strategy
- Taxonomies
- Sketches
- Wireframes
- Mockups
- Prototypes
- User testing
Implementation
- Code development
- QA testing
- Beta and public launch
03. Check
Measuring and iteration
Measuring
- Analytics review
- KPI performance
- Heat mapping
- Scroll mapping
- User testing
Iteration
- Bug fixes
- Qualitative user feedback
- Quantitative feedback
- User pain point reduction
- Feature innovation
01. Think
User Flows
A User Flow is a visual representation of a user’s path to complete tasks within a product. It includes origin and termination points, steps, decision points, interaction points, and more.
Ecosystem Maps
An Ecosystem Map helps to lay out a site or company’s digital properties in a way that clearly illustrates their purpose and the connections between them. This allows stakeholders to visualize the project in full context and develop a built-out strategy.
Red Route Analysis
This analysis will commonly play a role in part of a larger heuristic analysis. It uses analytical and qualitative data to identify which tasks are used frequently and by the largest audience, and which tasks are used infrequently and by the smallest audience. This helps drive IA and feature prioritization.
Personas
Personas are fictional identities that depict demographics, behaviors, needs and motivations of the user. They are critical in assisting the designers to create empathy throughout the process by “giving the user a face and a name”.
Scenarios
A scenario is a narrative describing “a day in the life” of a persona, which provides a picture of the intended user experience (i.e. what ideally should happen). This helps stakeholders think through the steps of the design and develop empathy for the user.
Project Evaluation and Prioritization
The PIE Framework
The PIE Framework evaluates and prioritizes design projects. It places a heavy focus on goals and efficiency, using three core factors: Potential, Importance, and Ease.
Potential
How much potential impact you expect the project to have. This is focused on hard impact, calculated directly against your Key Performance Indicators, like conversion or retention.
Importance
How important the project is to the company or the user. This is focused on soft impact, calculated against higher level goals or responsibilities, like branding and usability.
Ease
How easy you expect the execution of the project to be. This is calculated against design challenges, development limitations, resources available, launch deadlines, etc.
02. Make
Taxonomies
Taxonomies involve the classification, categorization, and organization of information. They can have a wide range of applications, from conceptual categorization to site map creation. An example use is a site taxonomy to extract an effective top-level navigation menu with primary and secondary categories, as well as sub-navs.
Wireframes
Wireframes are rapidly designed visual guides for determining page structure, hierarchy, and key elements. They are ideal for collaboration, iteration, and spec planning (especially with developers). They can be low or high fidelity. Examples would be a new product/event page (desktop and mobile viewport) and templates for supporting pages that would be replicated across the entire marketing offering.
Mockups
Mockups expand upon and finalize the information delivered by wireframes, while also incorporating the addition of visual design. They help bring to life the final design, from a visual and functional standpoint (in the case of prototypes). They can be low fidelity and high fidelity. An example can feature several low fidelity mockups from a client site redesign.
Learning and Iterating Quickly
The MVP
The Minimum Viable Product is the simplest design iteration necessary to validate a concept and value proposition as being viable, desirable, and feasible. It’s the first and fastest design iteration in my process.
Think
After an initial concept is presented, rather than ask “How do we build this?”, I instead ask “Should we build this?”. Research is therefore performed to drive the first iteration and prepare it for the design and validation phases.
Make
The MVP requires that we produce a design with the minimum fidelity and functionalities necessary to test the concept, but not more and not less. This prepares it for the validation phase.
Check
The design is tested with early adoption users, and if validated, the second iteration begins. If not validated, we iterate until we determine that we are no longer building an MVP and can disqualify the value proposition.
03. Check
Analytics Review
There are many different ways to approach an analytical review. In a particular example, extracting raw behavioral flow data from Google Analytics and using it to create user flow trends, as shown in the resulting flow chart. This helps to identify prominent user paths, high impact pages, potential usability issues, and more. Each page can be viewed at multiple different interaction points, meaning that pages may perform better or worse when presented to the user at a certain point or before / after certain other pages. This information can then be benchmarked against page-wide metrics, to provide performance context.
Heat Mapping
Heat maps track where users are clicking on a mockup, prototype, or live site. Scroll maps track where users are scrolling to and what areas of the page they’re looking at the most. They both assist in identifying key user flows, engagement areas, and usability issues. Example can use historical heat mapping and scroll mapping data to provide context around the performance of old pages.
User Testing
User testing can be performed at multiple points in the process, with a range of objectives. The primary purpose is to verify the design with actual users. For in-person moderated tests, a script can help gather information. For remote unmoderated tests, a screen recorder, microphone, and on-screen prompts can be used. Users can then be filtered via demographics and screened for persona fit. Conducting ongoing iterative tests with 3-5 users per round should be common practice. With time budgeted for setting up the test, recruiting participants, and analyzing the results, you can sometimes run a full study in a 24 hour period. This represents very fast, actionable feedback.